

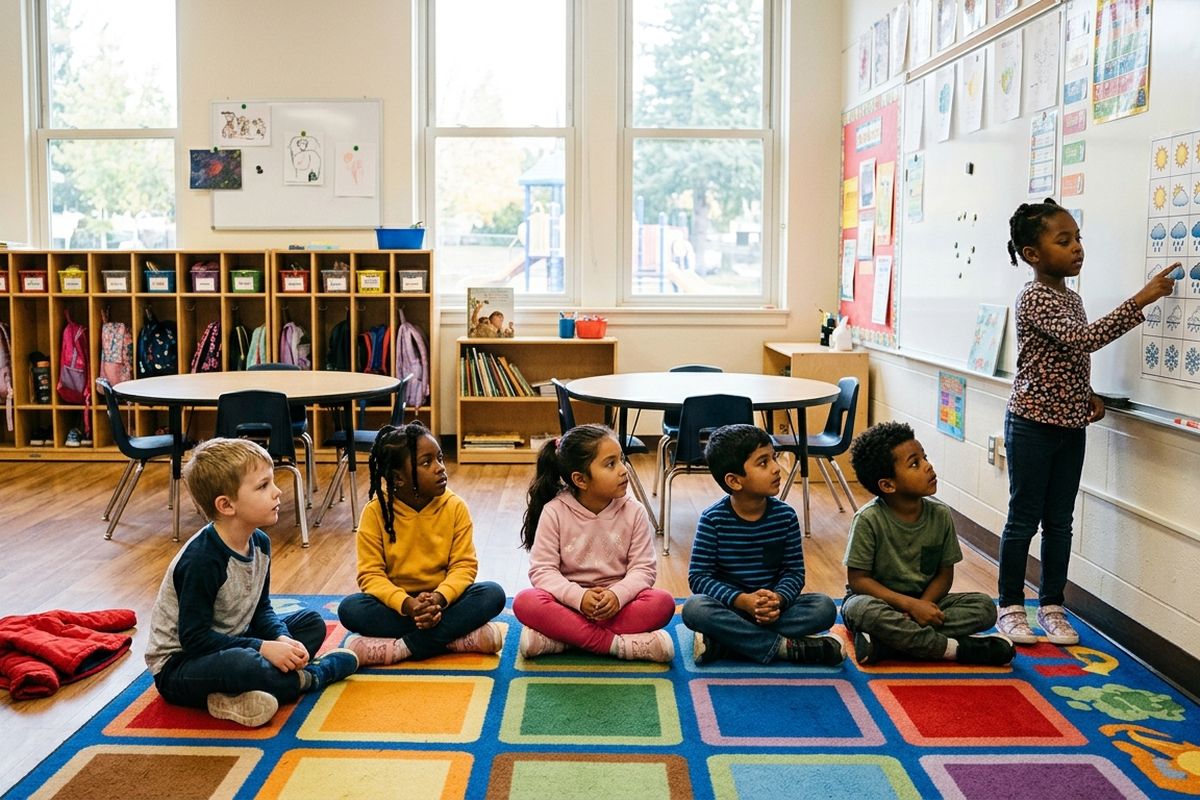
The kindergarten weather chart looks too cute to be math. A row of suns, a few gray clouds, one snowflake that caused a minor riot, all taped to the wall at crouching height. Then something comes home in the folder: favorite pets, apples picked, shoes with laces versus shoes with Velcro. It looks simple because it was built to look simple.
What that weather chart is actually teaching
In kindergarten and 1st grade, most data lessons are sorting and counting wearing a rain boot. Kids put each day into a group. Sunny, cloudy, rainy, snowy. They count how many landed in each group, then compare which group got more. Nobody says the word statistics to a 6-year-old, and nobody should.
The idea underneath it all is that one square means one day. Obvious to you. Not obvious to them. Young kids count the spaces between the squares, count the label at the bottom, or count the same square twice because the finger got ahead of the eye. This is normal. Irritating at 7:12 on a school morning, but normal.
Charts also teach categories, which is a fancy way of saying a day goes in one column and only one. That is where you get the kid who wants to add a tornado column because what if. Honestly, fair. The lesson is that the class agrees on the columns first so the counting means something.
By the end of 1st grade, most kids can handle three kinds of questions about a chart like that: how many sunny days, were there more sunny days or rainy days, and how many more sunny days than rainy days. That third one is subtraction in a friendly sweater.
Pictographs and the key nobody reads
Pictographs turn up around 2nd and 3rd grade, and they look harmless. Apples, stars, little basketballs. Then a line at the bottom says each apple = 2 students, and roughly half the class decides that line is decorative.
So the child counts four apples and writes 4. The answer is 8. The picture is not the amount, the picture is a shortcut, and that distinction is the entire lesson.
At my kitchen table I point at the key before we look at anything else. Not "what is this graph about," not "which one is biggest." Just: what does one picture stand for? Four seconds, and it heads off most of the wrong answers.
The key can count by 2s, 5s or 10s, which means your child is skip-counting and multiplying while pretending to read a cute little chart about pets. Then come the half symbols. If one whole apple is 2 students, half an apple is 1 student, and kids find this deeply unfair. They want half an apple to mean half a student, which is not the classroom vibe anyone is going for.
Bar graphs and the scale on the side
Bar graphs are where the numbers up the side start causing trouble. Early on the scale counts by 1s, which is peaceful. By 3rd grade the side of the graph often reads 0, 5, 10, 15, 20, and a bar that reaches the third line is 15, not 3.
If your child misses graph questions even though they clearly understand the graph, check the scale before you check anything else. A kid who is shaky counting by 5s is doing two hard things at once, and the graph gets blamed for the wrong one. This is one of the quieter reasons skip-counting matters more than it looks.
The other trap is a bar that stops between two lines. The graph counts by 10s, the bar lands halfway between 20 and 30, and the child either freezes or picks one of the numbers that is actually printed. Halfway between 20 and 30 is 25. That is estimating, and it deserves better than the side-dish treatment it usually gets.
Here's the trick nobody tells you: have your child read the scale out loud before answering anything. "This one counts by 5s." Said out loud, it sticks for the whole page.
The graph question on the test is a reading question
A lot of graph mistakes are not graph mistakes at all. The child reads the bars perfectly and then answers a different question than the one on the paper, because the words did the hard part and the words got skimmed.
The usual culprits are short. "How many more" means compare, usually by subtracting. "Fewest" means the smallest amount, not the shortest bar name. "Twice as many" means double. "In all" means add. "Difference" means subtract, although my own 4th grader once looked up from a worksheet and asked why they couldn't just say how far apart. I had nothing.
Put dogs at 12, cats at 8 and fish at 4 on a graph, then ask how many more students chose dogs than fish. The answer is 8. Not 12, not dogs, not "dogs are the most." The graph handed over the numbers. The question decided what to do with them.
Which is the same reason word problems knock over kids who can calculate just fine, and the same gap that shows up in reading when a child gets every word right and still misses what was asked. A pencil helps: underline the action words, then go back to the graph. No highlighters needed.
A sock-drawer graph on a Tuesday
You do not need a printable for this. Ten minutes, the back of an envelope, and a sock drawer that is already a small laundry crime scene.
Pick one category and hold the line: sock color. Not color plus size plus whose they are plus emotional history. Dump out a handful and tally:
- White: 6
- Black: 4
- Blue: 3
- Pink: 1
- The one with pizza slices on it: "other," because I have limits
Then draw quick bars. Small numbers, count by 1s. If you have somehow produced 24 white socks, count by 2s and call it character building. Ask which color has the most, how many more white than blue, and what happens to the black column when one more turns up under the couch.
Then let your child ask one question. That part matters more than the graph does. When kids write the question, graphs stop being decorations with answers attached and start being information about something. Sometimes the question is strange. "Which socks are the most boring?" Fine. Make them define boring first, because defining the category is exactly what data people do all day.
The same ten minutes works on the fruit bowl, the spoon drawer, or which family member leaves the most shoes by the front door, and it runs on the same fuel as the math already hiding in groceries and cooking. Count what is there, compare it, make one small decision from the numbers. I have done the sock version while dinner was actively considering burning.


